

Get monthly notifications
What is Google Data Studio?
Google Data Studio is a data visualisation tool for making comprehensible and engaging reports from different data sources – such as Google Ads, Google Analytics, MySQL or YouTube. With Google Data Studio, you can easily set up charts and build your own reports in a simple drag-and-drop interface – without needing any special skills or experience in data reporting systems.
Pro Tip! Before even jumping into Google Data Studio – make sure your data is complete and accurate.
1. Connect all your relevant data sources – and use Google Sheet to present all that extra data
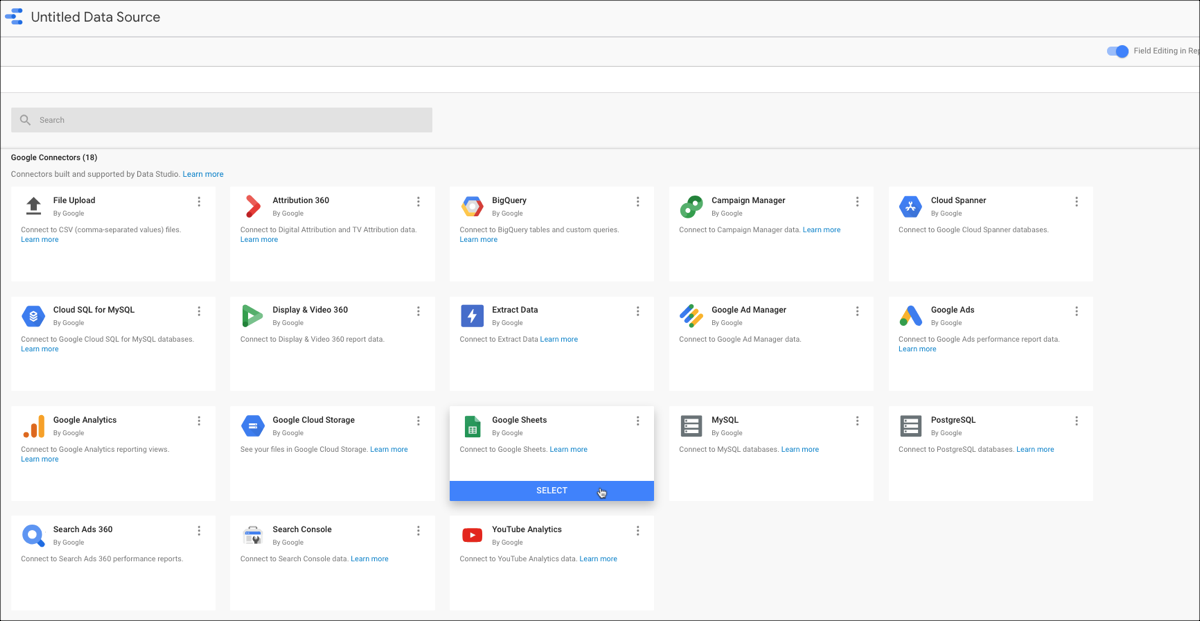
Google Data Studio has all your preferred data linked right from the start. With 18 of Google’s own data sources, and about 100 of other different partner data sources connected – you’ll have complete access to any data in your business. And even if your specific data source is missing – anything you can get into a Google Sheet is data you can visualize in Google Data Studio. Using Google Sheets, you can also collect data from different sources into the same graph!
2. Create your first report – from scratch or from template
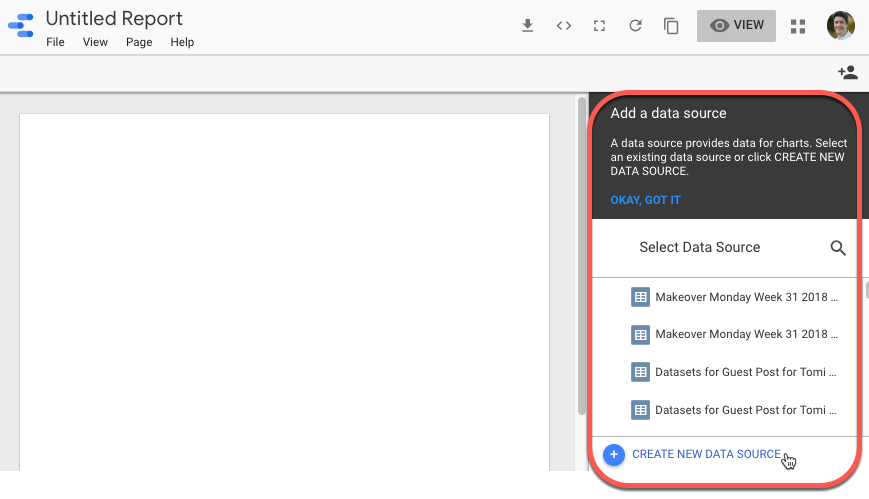
Get started with your Google Data Studio career by creating new report from a blank page. You can also choose a predefined template to make a report straight from, for example, Google Ads, Google Analytics, Google Search Console or Youtube Analytics. To connect data to your report, click the button “Create a new data source”.
Here, you’ll be presented with a spreadsheet of fields and metrics that Google Data Studio extracted from your data source. Start building your report by adding these different metrics from your data source – and watch how the fun begins!
3. Start experimenting!
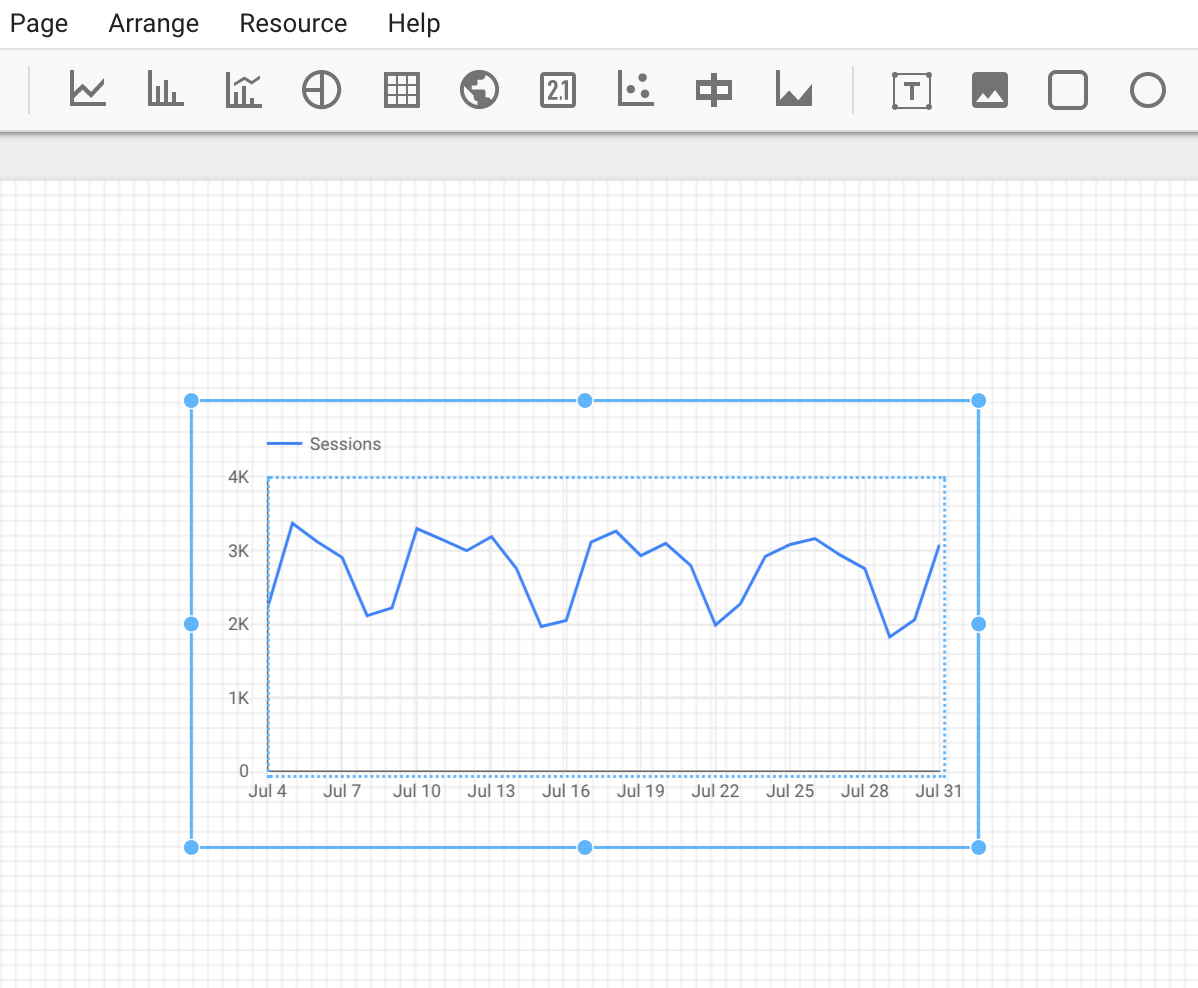
Start customizing your report by working with the presentation of your different data metrics. Try different charts and connect different data sources to get an understanding of Google Data studio’s vast visualization options. Build your dashboard by creating everything from pie charts, scatter charts and tables to geo maps and time series.
Drag and drop charts, add different filters, edit the current object in the options panel and create new pictures, shapes and text blocks from scratch. Working with the different data metrics, you’ll soon find yourself with a customized dashboard. And don’t forget to toggle into presentation mode to view the report in its final form!
Tip! Start working with small sets of basic data to get to know Google Data Studio, and easily compare your visualized report with the original data.
4. Share, edit and present with different options
As with lots of Google’s other products, Data Studio is also a great collaboration tool. Your reports are automatically saved, and it’s easy to share access with other users. Colleagues can work on the report at the same time, seeing one another’s changes live as they happen. It’s also easy to share reports and dashboards with others, for example clients, who only should have viewing access.
Another feature in Google Data Studio is the interactive presentation mode – collecting different charts into one, making it easier to present and show comparisons live before an audience, for example. See an example of interactive chart.
Why should I use Google Data Studio?
Google Data Studio is data analysis made easy, from your very first report. And not only easy – when you get a hang of data visualization, your analyses can also be very engaging, intriguing and even beautiful.
Google Data Studio includes every best practise of data analysis – from choosing relevant, updated metrics to keeping it visual and easy to read, as well as accessible. Use this versatile tool to get a whole new understanding of data and collaborate around it to make new, improved decisions for your business. When looking at your data differently, you can raise those rare but important questions that need to be addressed.
Get more ideas from our blog on search ad position metrics.
Featured Articles
The Full Funnel Approach and Pinterest
Today, we're going to delve into the significance of working with a full-funnel strategy and understanding why a comprehensive media mix is crucial. We'll also explore an example of how this approach and including Pinterest in the media mix led to a significant decrease in the cost of sales for Houdini.
Master Text Overlays: Boost Ad Engagement
In recent years, capturing the attention of your target audience has become more challenging than ever. Businesses and marketers are constantly on the lookout for innovative ways to stand out in the crowded advertising landscape.
One effective technique to draw attention to your ad's message is through the use of text overlays on image and video ads. In this blog, we will explore the best practices for incorporating text overlays, ensuring your message is impactful without compromising the visual appeal of your ads.